Basic Candlestick Patterns
Candlestick patterns are essential tools in technical analysis, helping traders understand market sentiment, price trends, and potential reversals. By interpreting these patterns, traders can anticipate price movements and make more informed decisions. Below are some of the most common basic candlestick patterns.
- TYPES OF CANDLESTICK PATTERNS
1. Bullish Patterns
These patterns indicate that the market may be trending upward or that a reversal from a downtrend is about to occur.
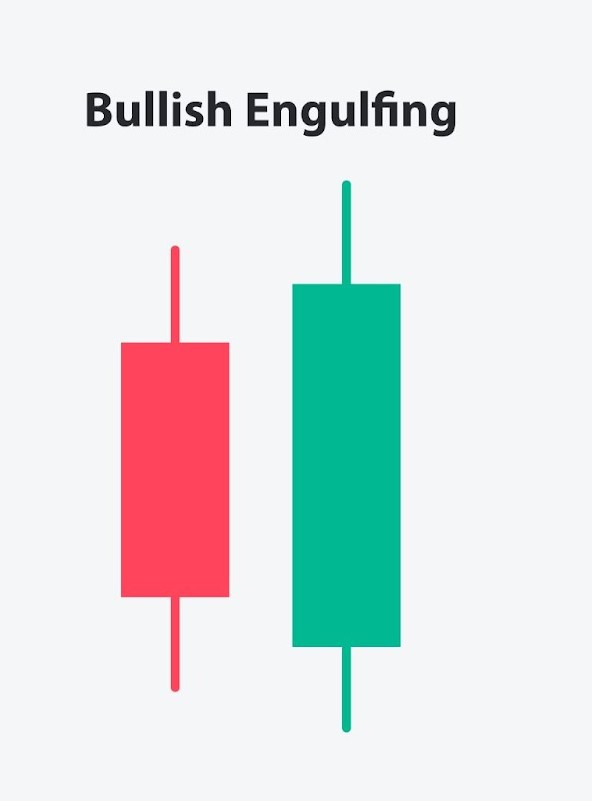
Bullish Engulfing
- Description: This pattern consists of two candles. The first candle is small and bearish (red), while the second candle is large and bullish (green). The second candle completely engulfs the first one, signaling a reversal from a downtrend to an uptrend.
Hammer
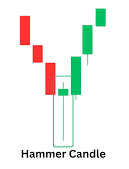
- Description: A small body at the top with a long lower wick. The wick should be at least twice the length of the body. It appears after a downtrend.
- Indication: A potential reversal from a downtrend to an uptrend, as it suggests that sellers tried to push the price lower but buyers took control by the end of the period.
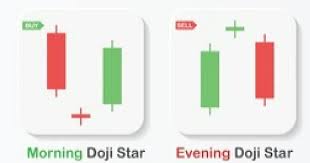
Morning Star
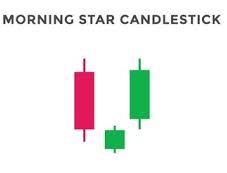
- Description: This pattern consists of three candles. The first is a large bearish candle, followed by a small-bodied candle (which can be either bullish or bearish), and then a large bullish candle.
- Indication: This pattern indicates a reversal from a downtrend to an uptrend and signals that the market is regaining strength.
2. Bearish Patterns
These patterns indicate that the market may be trending downward or that a reversal from an uptrend is about to occur.
Bearish Engulfing
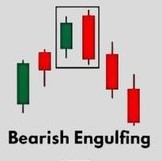
- Description: This is the opposite of the bullish engulfing pattern. The first candle is small and bullish (green), and the second candle is large and bearish (red). The second candle completely engulfs the first one.
- Indication: A potential reversal from an uptrend to a downtrend, signaling the beginning of a bearish move.
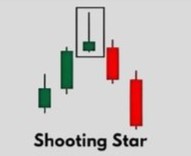
Shooting Star
- Description: The shooting star has a small body near the bottom of the candlestick, with a long upper wick. It appears after an uptrend.
- Indication: A potential reversal from an uptrend to a downtrend, as the long upper wick suggests that the market tried to go higher, but sellers took control by the end of the period.
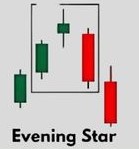
Evening Star
- Description: This pattern is the opposite of the morning star. It consists of three candles: a large bullish candle, followed by a small-bodied candle, and then a large bearish candle.
- Indication: This is a bearish reversal pattern, indicating that an uptrend is losing strength and a downtrend may be about to begin.
3. Neutral Patterns
These patterns are less clear in their signals but can provide valuable insight into market indecision or consolidation.
Doji
- Description: A Doji candlestick has an extremely small body, where the open and close prices are almost the same. It has long upper and lower wicks.
- Indication: A Doji indicates indecision in the market. It suggests that buyers and sellers are in balance, and the next candle will be important to confirm the direction of the trend. A Doji can signal either a potential reversal or continuation depending on its location within the trend.
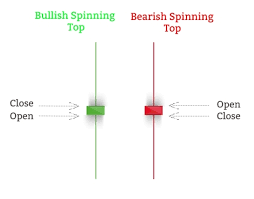
Spinning Top
- Description: A spinning top has a small body with long wicks above and below. It shows that both buyers and sellers are in control, but neither side is dominant.
- Indication: It indicates indecision in the market and can often lead to consolidation before the next move.
4. Reversal Patterns vs. Continuation Patterns
Candlestick patterns can either signal a trend reversal or trend continuation. Reversal patterns suggest that the current trend (up or down) may soon change direction, while continuation patterns indicate that the existing trend will likely continue after a brief consolidation or pause.
5. How to Use Candlestick Patterns in Trading
- Trend Confirmation: Use candlestick patterns to confirm trends and improve the accuracy of your trade entries. For example, a bullish engulfing pattern after a downtrend signals a potential buy, while a bearish engulfing pattern after an uptrend signals a potential sell.
- Risk Management: Combine candlestick patterns with other technical indicators, such as moving averages or support/resistance levels, to validate your trades and manage risk effectively.
- Timeframe Considerations: Candlestick patterns are effective across different timeframes. However, the reliability of patterns generally increases on higher timeframes like daily and weekly charts.
Conclusion
Candlestick patterns are powerful tools for analyzing price action and predicting future market movements. By learning to recognize these basic patterns and understanding their significance, traders can enhance their technical analysis and make more informed decisions in the stock market.
-: BEST OF LUCK :-
